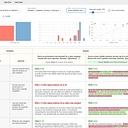
LangSmith holds a narrow lead over Braintrust for end-to-end LLM observability, prompt tracing, and pipeline debugging. Braintrust becomes the usual choice when teams need to analyze user prompts and surface failure themes.
LangSmithChatGPT Search100%Google AI Mode90%ChatGPT SearchGoogle AI Mode
BraintrustChatGPT Search100%Google AI Mode86%ChatGPT SearchGoogle AI Mode
LangfuseChatGPT Search100%Google AI Mode81%ChatGPT SearchGoogle AI Mode
Arize PhoenixChatGPT Search95%Google AI Mode62%ChatGPT SearchGoogle AI Mode
LangChain LangGraphChatGPT Search68%Google AI Mode5%ChatGPT SearchGoogle AI Mode
LangChainChatGPT Search45%Google AI Mode10%ChatGPT SearchGoogle AI Mode
Questions and answers
I need to trace my LLM application execution to figure out why I'm seeing latency bottlenecks and unexpected model outputs. What tools can help me perform root-cause analysis on these failures?
To diagnose latency bottlenecks and root-cause unexpected outputs in an LLM application, you need specialized LLM observability and tracing platforms . Traditional application performance monitoring (APM) tools miss the non-deterministic nature, token costs, prompt structures, and multi-step reasoning loops of modern LLM stacks.[](https://www.youtube.com/watch?v=4Qu2-xt-MCo&t=21)
The top tools for tracing and root-cause analysis fit into open-source, flexible, and enterprise-grade categories:
We need a solution for end-to-end LLM observability, including tracing and testing. Which platforms allow us to evaluate and debug these integrations during CI/CD?
I'm looking for a tool that can analyze our user prompts and identify common themes or failure cases. What is the best prompt analytics tool?
Summary
Braintrust is the usual answer for analyzing prompt themes and surfacing recurring failure patterns.
We want to create a comprehensive test suite for our production LLM prompts. What's the best framework for prompt unit testing and integration testing?
Summary
Multiple testing frameworks are cited for prompt unit tests and integration suites without a single standout choice.
The problem is, we don't know if our LLM is drifting over time. What's the best observability tool for detecting LLM output drift?
Other topics in LLM Observability and Evaluation Platforms
Arize Phoenix is an open-source, local-first visualization and evaluation tool built on OpenInference standards, perfect for notebook environments and self-hosted root-cause analysis of complex agentic loops.[](https://newrelic.com/blog/ai/llm-observability)
LangSmith is deeply integrated if your stack relies on LangChain or LangGraph, offering robust debugging, dataset evaluation, and fine-grained latency breakdowns per span.
Helicone is a lightweight, proxy-based open-source monitoring tool that works out-of-the-box with minimal code changes to track latency and token usage instantly.
Braintrust is an evaluation-first platform that connects production traces directly to regression testing datasets and quality scoring.[](https://newrelic.com/blog/ai/llm-observability)
If you want to narrow down the best choice, tell me:
What framework or orchestration library are you using (e.g., LangChain, LlamaIndex, custom API calls)?
Do you prefer a self-hosted/open-source tool or a managed cloud service?
For diagnosing latency bottlenecks and unexpected outputs in an LLM application, you want LLM observability and tracing tools that let you reconstruct an execution end to end: which model was called, what prompts and context it received, how long each step took, which tools ran, and where the output diverged from expectations.
The key is to correlate execution traces, latency metrics, prompts, model responses, and errors in a single investigation. This is especially important for applications using agents, retrieval-augmented generation (RAG), chains, or multiple model calls.
1. Tools worth evaluating
1. LangSmith
(Best for LangChain / LangGraph)
Inspect nested execution traces, intermediate outputs, tool calls, prompt inputs, and errors. Useful when an agent takes the wrong branch or a chain produces an unexpected result.
Explore:
2. Langfuse
(Best open-source option)
Trace model calls and application steps, compare prompt versions, monitor latency and token costs, and investigate individual requests. Particularly attractive if self-hosting and data control matter.
Explore:
3. Arize Phoenix
Best for RAG and model-behavior debugging.
Inspect traces across retrieval, reranking, prompt construction, and generation. Its tracing, evaluation, and span-replay capabilities help determine whether a bad answer originated in the retrieved evidence or the generation step.
Explore:
4. Braintrust
Best for turning failures into regression tests.
Examine traces alongside evaluation scores, compare model or prompt changes against datasets, and catch quality regressions before deploying changes.
Explore:
5. Helicone
Best for quick request-level visibility.
Monitor request and response records, latency, usage, and costs, especially when you want visibility into model API traffic without building an elaborate tracing system first.
Explore:
6. Datadog
Best for end-to-end infrastructure bottlenecks.
Correlate LLM activity with application traces, downstream services, database queries, errors, and infrastructure metrics. Especially useful when model latency is only one part of a slow request.
Explore:
These tools overlap, so you don't need all six. The most useful starting point depends on whether the failure is primarily in agent orchestration, retrieval and generation, evaluation, or infrastructure. This shortlist reflects their documented capabilities and typical areas of strength.
2. Which tool helps with which failure?
Symptom
What to inspect
Good starting point
Slow responses
Span durations, time to first token (TTFT), model queueing, retries
Langfuse, Datadog
Wrong or hallucinated answers
Prompt version, retrieved chunks, context assembly, model response
For a vendor-neutral foundation, consider OpenTelemetry. It provides common tracing and telemetry standards that can connect your application spans to compatible observability backends.
3. A practical root-cause analysis workflow
Step 1 — Capture a complete trace
Record a request ID, model and version, prompt/template version, input/output token counts, timestamps, and nested spans for retrieval, tools, model calls, and application code.
Step 2 — Find the latency bottleneck
Inspect the slowest spans and compare total duration with model execution time. Check time to first token versus total generation time, retries, sequential calls that could run in parallel, and retrieval or network delays.
Step 3 — Find where the output went wrong
Follow the trace from input to final response. Identify the first stage where data or behavior diverged: incorrect retrieval, malformed tool arguments, lost context, changed prompt, or unexpected model completion.
Step 4 — Reproduce and verify the fix
Replay the relevant inputs where supported, control model parameters and versions, run targeted evaluations, and add the failing example to a regression dataset.
A crucial distinction: tracing tells you what happened; evaluation helps determine whether the output was good. Use both for unexpected outputs, because a request can succeed technically while returning an incorrect answer.
4. My recommendation
Using LangChain or LangGraph? Start with LangSmith.
Want open-source tracing and flexible deployment? Start with Langfuse.
Debugging RAG pipelines or retrieval quality? Start with Arize Phoenix.
Need to systematically prevent quality regressions? Add Braintrust or an evaluation workflow.
Already have complex production infrastructure? Integrate OpenTelemetry with your existing APM tooling.
One final consideration: traces can contain sensitive prompts, retrieved documents, and tool arguments. Configure redaction, access controls, and retention policies before enabling production capture.
Let’s narrow this down to your application
What stack are you using? For example, Python with LangChain, a TypeScript agent using the OpenAI API, a RAG pipeline, or a custom orchestration framework.
If you share that and whether the bigger issue is latency, incorrect outputs, or both, I can recommend a concrete tracing setup and show you how to instrument it.
Deep tracing for LangChain/LangGraph and generic LLM calls
Integrates with pytest , GitHub Actions, and custom workflows to run dataset evaluations and block PRs on score drops
Cloud-hosted with hybrid control plane options
Langfuse
Comprehensive tracing, prompt management, and cost tracking
SDK-based evaluations that run locally or in CI pipelines, reporting metrics back to the central dashboard
How CI/CD Evaluation Works in Practice
Dataset Versioning: Maintain a golden dataset of inputs, expected outputs, and edge cases stored alongside your application code or synced via the platform's dataset registry.
Programmatic Evaluation: Execute your test suite (using framework tools like pytest combined with the platform SDK) to run the golden dataset against the newly proposed prompt or model logic.[](https://www.langchain.com/langsmith/evaluation)
Assertion & Blocking: Score outputs using code-based assertions (e.g., regex, JSON schema) or model-as-a-judge metrics (e.g., hallucination score, relevance). Fail the build if performance metrics drop below your defined threshold.[](https://www.youtube.com/watch?v=nWNWrtCDqaY&t=10)[[2]()]()
To help narrow down the ideal platform for your team, tell me:
Do you require self-hosting/on-premise compliance, or is a cloud-managed service preferred?
Are you heavily tied to a specific framework like LangChain, LlamaIndex , or raw API calls?
For an end-to-end LLM observability solution that covers tracing, evaluation, debugging, regression testing, and CI/CD validation, the main platforms to evaluate are:
Platform
Tracing
Evaluation / Testing
CI/CD Integration
Best Fit
LangChain
✅ Full LLM/agent traces
✅ Dataset-based evals, regression tests
✅ Can be used for automated evaluation gates
Teams building LLM apps and agents, especially with LangChain/LangGraph
Best LLM observability platforms for tracing, monitoring, and CI/CD testing
As of October 2026, several platforms cover the full LLM application lifecycle: tracing model and agent execution, monitoring production behavior, evaluating response quality, and running regression tests before deployment.
My shortlist is Langfuse, LangSmith, Braintrust, Arize Phoenix/AX, and Comet Opik.Datadog and New Relic are also worth evaluating if you want LLM observability integrated with broader application performance monitoring. These tools differ most in how deeply they support automated quality evaluations and CI/CD release gates, rather than just collecting traces.
1. Platforms to evaluate
1. Langfuse
Best all-around open-source option
Provides LLM traces, prompt management and versioning, datasets, evaluations, usage and cost tracking, and production monitoring. Its framework-agnostic instrumentation and self-hosting options make it suitable for varied LLM stacks.
CI/CD fit: Run evaluations against datasets in automated test workflows and compare quality across prompt or model changes.
Offers detailed traces of chains, agents, model calls, and tool execution, along with datasets, experiment comparisons, evaluations, and production observability.
CI/CD fit: Run evaluations against test datasets to catch regressions before promoting application changes. Particularly attractive if you're already using LangChain or LangGraph.
Best for evaluation-driven development and release gates
Connects experiments, datasets, scorers, and production traces to help teams measure LLM quality systematically.
CI/CD fit: A particularly strong candidate for automated evaluations that fail a build or block a release when quality drops below a defined threshold.
Supports OpenTelemetry/OpenInference-based instrumentation, trace inspection, datasets, experiments, and evaluations. It is particularly useful for debugging retrieval-augmented generation (RAG) and complex LLM workflows.
CI/CD fit: Combine programmatic evaluations and experiment-based regression tests with your existing CI runner. Consider Arize's commercial platform, AX, for broader enterprise monitoring and workflows.
Best for open-source evaluation of LLMs and agents
Combines tracing, evaluation metrics, experiments, and production monitoring for LLM applications and multi-step agents.
CI/CD fit: Use evaluation datasets and automated scoring to validate changes to prompts, models, and agent behavior before release. Worth considering if you want an open-source-friendly alternative.
Adds LLM and agent execution visibility to broader application monitoring, making it easier to correlate AI failures with service health, latency, and infrastructure issues.
CI/CD fit: Useful as part of an existing telemetry and release-monitoring setup; validate whether its evaluation and regression-testing capabilities meet your specific pre-deployment requirements.
Website:
7. New Relic AI Observability
Best for connecting AI quality with application performance
Extends application observability with AI quality and safety evaluations, performance and cost signals, and pre-production testing workflows.
CI/CD fit: A promising option if you want quality checks and production performance in the same observability environment. Confirm the precise automated test and pipeline integrations available for your deployment.
Website:
The distinctions above are based on vendor documentation and comparative platform reviews; CI/CD suitability means the platform can support an automated testing workflow, not that every integration is available natively in every edition.
2. Feature comparison
This matrix focuses on the three capabilities you specifically requested.
Platform
Tracing
Production monitoring
CI/CD evaluations
Langfuse
Full LLM traces
Cost, latency, scores
Dataset-based regression tests
LangSmith
Deep chain and agent traces
Runs, errors, feedback
Dataset-driven evaluations
This is a high-level capability comparison, not a guarantee that every feature is included in every plan. Sources:
3. How to choose
If you want one platform for most requirements
Start with Langfuse. It offers a flexible combination of tracing, evaluation, prompt management, and deployment options.
If CI/CD quality gates are the priority
Evaluate Braintrust first, then LangSmith and Langfuse. Test whether each can enforce your exact pass/fail criteria in GitHub Actions, GitLab CI, Jenkins, or your existing pipeline.
If you need self-hosting and open instrumentation
Shortlist Langfuse and Arize Phoenix. Check licensing, data residency, and whether your existing instrumentation can use standard OpenTelemetry conventions.
If you need enterprise-wide observability
Consider Datadog or New Relic when you already use their APM products and want to correlate LLM failures with conventional application telemetry.
4. What a complete LLM CI/CD workflow should look like
Regardless of which platform you choose, look for a workflow like this:
1. Code or prompt change
Commit, pull request, or model update
2. Automated evaluation suite
Golden datasets, correctness, relevance, safety, tool use
Trace real runs, detect quality drift, and add failures to regression datasets
A crucial distinction: tracing tells you what happened; evaluation tells you whether it was good; CI/CD gates determine whether a change is allowed to ship. Make sure your shortlisted platform supports all three, rather than relying on trace dashboards alone.
5. A few questions to narrow the shortlist
Choose your requirements and I'll recommend the best-fit platforms.
What framework are your LLM integrations using?
LangChain / LangGraph
LlamaIndex
Multiple frameworks or custom SDKs
Where must the platform run?
Cloud SaaS
Self-hosted / private infrastructure
Either
What matters most?
Automated tests and release-blocking quality gates
The leading platforms addressing tracing, monitoring, and CI/CD testing integration include:
LangSmith
Best For: Deep, native debugging and end-to-end management for complex agentic workflows (especially those built on LangChain or LangGraph, though framework-agnostic via API).
LangSmith
Quality drops after a deployment
Prompt/model version comparisons, evaluation scores, regression datasets
Braintrust
High token costs
Input/output tokens, repeated calls, long contexts, retry loops
Langfuse, Helicone
Slow database or external API
Distributed traces across application and infrastructure services
Datadog, OpenTelemetry
Yes (MIT License, fully self-hostable)
Braintrust
Production logging, latency metrics, and user feedback tracking
Built explicitly for experiment tracking; runs automated test suites and evals natively in CI/CD workflows
OpenTelemetry-based tracing → capture every LLM/tool/retrieval step
Evaluation platform → run automated quality tests in CI
Data store for failed traces → convert incidents into regression tests
A practical evaluation stack would be Phoenix or Langfuse for tracing + Braintrust/LangSmith-style eval gates + your existing CI system (GitHub Actions, GitLab CI, Jenkins, etc.).
Trace analysis; broader enterprise monitoring with AX
Programmatic evals and experiments
Comet Opik
LLM and agent traces
Metrics and evaluation scores
Automated evaluation workflows
Datadog
LLM and agent traces
Integrated APM and telemetry
Validate evaluation and test automation fit
New Relic
AI execution observability
AI quality and application health
Pre-production evaluation workflows
Tracing & Monitoring: Records multi-turn run trees, tool executions, latency, and granular token costs. Provides real-time production monitoring dashboards and automated feedback collection.
Best For: Developer-first, code-native unit testing of LLMs.
Tracing & Monitoring: Offers lightweight tracking that hooks directly into application execution.
CI/CD & Testing: Functions like a traditional pytest framework tailored specifically for LLMs and RAG validation. It is built from the ground up to execute inside standard CI/CD runners (like GitHub Actions) to fail builds on metrics like toxicity, hallucination, or answer relevance.[](https://www.lyzr.ai/blog/best-tools-for-llm-evaluation/)
If you'd like to narrow this down, tell me:
Are you self-hosting or looking for a managed cloud service?
Are you primarily building RAG applications or autonomous AI agents?
I can help recommend the ideal integration setup for your specific tech stack.