Can you recommend monitoring software that offers granular control over payload scrubbing and sampling retention without losing the context required for failure reproduction?
I'm looking for application monitoring software that balances payload scrubbing and sampling retention with the ability to maintain sufficient context for troubleshooting.
New Relic : Provides distributed tracing with customizable drop filters and obfuscation rules at the agent level. It allows security rules to scrub attribute keys/values matching sensitive regex patterns while retaining error analytics, transaction breakdowns, and slow-query context.
Sentry : Distinctly focused on error and exception lifecycle management. Sentry captures 100% of unhandled errors by default (bypassing traditional head-based sampling limitations for failures) and includes powerful data scrubbing features (sendDefaultPii , scrubbing rules for breadcrumbs, local variables, and request bodies) to strip sensitive tokens while preserving the local variables and stack frames needed to reproduce the crash.
The strongest application-monitoring tools for this requirement are Sentry, Datadog, and New Relic, with OpenTelemetry-based observability pipelines worth considering when you want more control over the data before it reaches a vendor.
The key is balancing three things:
Sampling: Keep enough representative events and traces to investigate intermittent failures without collecting everything.
Retention: Preserve high-value debugging data long enough for delayed investigations.
Payload scrubbing: Remove secrets and personally identifiable information (PII) while retaining stack traces, request structure, trace relationships, and other useful diagnostic context.
Best tools to evaluate
1. Sentry
(Best for failure reproduction)
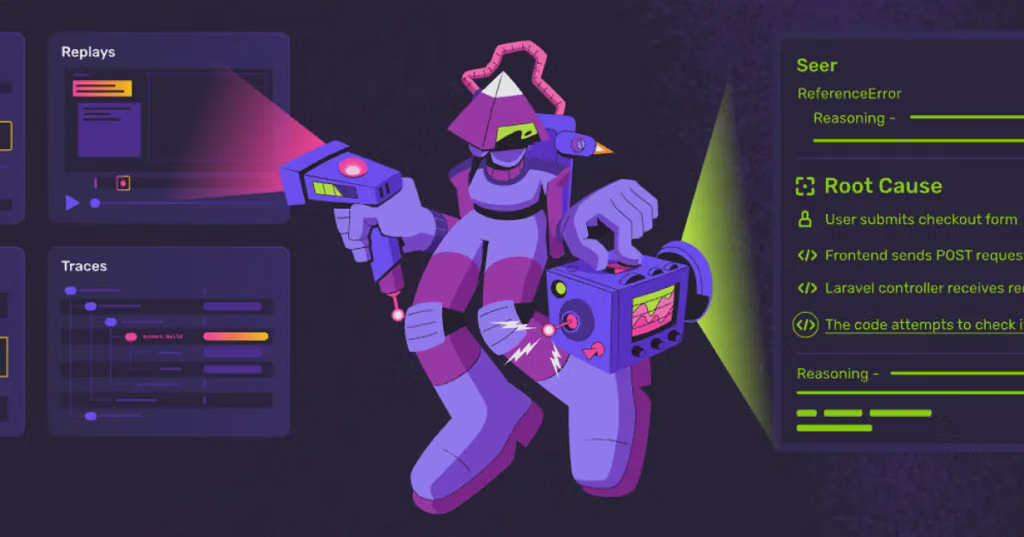
Sentry combines error tracking, distributed tracing, and session replay. You can capture the user actions leading up to a failure, set separate sampling rates for normal sessions and error-triggered replays, and mask sensitive data by default.
Sampling: Configurable session and error replay rates.
Scrubbing: SDK-side beforeSend, server-side rules, and replay privacy controls.
Retention: Review plan-specific event and trace retention limits.
Best when developers need to reproduce a specific UI or application error.
Datadog provides trace sampling and retention controls, plus sensitive-data detection and redaction across logs, APM spans, and real-user monitoring events. Retention rules can prioritize error traces, slow requests, and critical endpoints.
Sampling: Prioritize unusual latency, errors, and selected services.
Scrubbing: Configure redaction, partial redaction, hashing, or masking where supported.
Retention: Retain selected traces for investigation without storing every request.
Important: Cloud-side scrubbing happens after telemetry leaves your environment. Use agent- or SDK-side controls when sensitive data must never be transmitted.
A strong option for teams that need configurable data retention and APM transaction diagnostics. New Relic supports agent-side obfuscation, configurable event sampling limits, and retention settings that vary by data type and plan.
Sampling: Tune event collection limits and tracing behavior.
Scrubbing: Obfuscate SQL literals and configure browser or log redaction.
Retention: Manage retention by data category, subject to plan limits.
Best for maximum control over data handling. It is a telemetry pipeline rather than a complete monitoring UI. Processors can filter, transform, redact, and enrich data before forwarding it to a monitoring backend. Tail sampling can retain complete traces based on errors or latency, with suitable configuration.
Sampling: Decide after seeing trace outcomes, rather than sampling only at request start.
Scrubbing: Remove or replace sensitive attributes before export.
Retention: Choose a downstream backend with the retention policy you need.
How to preserve enough context to reproduce failures
Regardless of which platform you choose, I would configure the monitoring pipeline around these principles:
Keep all errors and high-value failures. Capture 100% of error-triggered replays where feasible, and prioritize failed or slow distributed traces. Apply lower sampling to routine successful requests.
Scrub before transmission. Remove authorization headers, cookies, access tokens, passwords, and sensitive query parameters in the SDK or a controlled collector.
Preserve diagnostic structure. Retain exception types, stack traces, release and deployment IDs, environment, service names, trace IDs, sanitized request metadata, and relevant span relationships.
Capture reproducible context safely. Use sanitized breadcrumbs, network timing, console errors, and session replay. Avoid storing raw request bodies or unrestricted user input.
Set retention by diagnostic value. Keep high-value errors and traces long enough to cover the time between occurrence, detection, and investigation. Verify actual retention limits for your subscription.
Test the controls. Inject a known failure containing synthetic secrets, confirm the failure remains diagnosable, and verify the secrets never appear in transmitted or stored telemetry.
My recommendation
Choose Sentry if reproducing individual application and frontend failures is the primary goal.
Choose Datadog if you need broad, cross-service observability with configurable trace retention and sensitive-data controls.
Choose OpenTelemetry Collector plus your preferred backend if controlling data before it leaves your infrastructure is the highest priority.
One important distinction: scrubbing and reproduction are not opposites. You usually need the structure and sequence of an event, not the original secret or personal value. Carefully chosen metadata and consistent trace identifiers preserve much of the debugging value without retaining unnecessary sensitive payloads.
If your priority is granular payload scrubbing, configurable sampling, and retaining enough context to reproduce production failures, I’d shortlist Sentry, Datadog, and Honeycomb with Refinery. They address different parts of the problem: privacy controls, error/session reproduction, and trace-aware sampling.
The most important architectural decision is to scrub sensitive data before it leaves your environment, while preserving the relationships and diagnostic fields needed to understand a failure. Sampling and redaction should be separate policies: you can retain a complete trace without retaining every sensitive payload field.
Recommended tools
1. Sentry
(Best for error reproduction)
Sentry combines error tracking, distributed tracing, and Session Replay. Replay can connect user actions with errors, logs, network activity, and traces. Text and inputs are masked by default, with configurable privacy controls.
Scrubbing: SDK hooks such as beforeSend, advanced server-side rules, and Relay for filtering before forwarding.
Sampling: Separate session and error-triggered replay rates, with selective replay capture.
Context preservation: Particularly strong for reproducing UI and frontend failures, including the sequence of actions preceding an error.
Trade-off: Server-side scrubbing occurs after transmission. Use SDK-side scrubbing or a controlled Relay if sensitive fields must never leave your infrastructure.
Datadog is a strong option when you need coordinated control across logs, APM traces, and real-user monitoring.
Scrubbing: Sensitive Data Scanner supports redact, partial redact, hash, and masking actions, with custom matching rules.
Sampling and retention: Tag-based retention filters and Intelligent Retention can prioritize representative and error-related traces while retaining their distributed context.
Context preservation: Well suited to correlating service failures across traces, logs, and infrastructure telemetry.
Trade-off: Cloud-side scanning redacts after telemetry has left your environment. Datadog's Observability Pipelines can process and redact logs before forwarding them. Also, sampled scanner data has restrictions on available obfuscation actions.
Honeycomb is worth considering if your main challenge is reducing telemetry volume without losing the evidence needed to diagnose a distributed failure.
Sampling: Refinery makes tail-based decisions after inspecting whole traces, so a trace can be retained based on its outcome or attributes rather than randomly sampling individual spans.
Scrubbing: Use an OpenTelemetry Collector or another controlled processing layer to redact or transform sensitive attributes before export.
Context preservation: Keep related spans together and prioritize error traces, unusual latency, and specific service conditions.
Trade-off: Refinery handles sampling; it is not a complete payload-privacy system by itself. You must design and validate the redaction pipeline separately.
For sensitive workflows, preserve a sanitized representation of the inputs rather than the original payload. If exact payload reproduction is necessary, consider a separately secured, access-controlled capture system with explicit consent or authorization, short retention, and audit logs.
One important caveat: retaining every error trace does not guarantee reproducibility. You may also need deterministic identifiers, relevant application state, dependency responses, and versioned configuration. Avoid recording secrets just to capture that context.
My verdict
Choose Sentry if your primary need is reproducing application errors and the user interactions that preceded them.
Choose Datadog if you need centralized monitoring and retention controls across a large infrastructure.
Choose Honeycomb + Refinery if your biggest challenge is preserving complete distributed traces while aggressively reducing telemetry volume.
Before committing, run a proof of concept with representative failures and verify that redaction happens at the required point, sampling retains all relevant spans, and the resulting records can actually reproduce the failure.
One question that would help me narrow this down: Are you primarily monitoring web/application errors, distributed backend services, or LLM/agent workflows? The best fit changes considerably depending on which kind of payload and failure context you need to preserve.
Achieving granular control over payload scrubbing and retention while preserving failure context requires separating the telemetry routing/processing layer from the storage/analytics backend , or utilizing an advanced observability pipeline. Standardizing on a single rigid monitoring agent often forces an all-or-nothing compromise between high storage bills and missing failure context.
Recommended approaches and tools capable of handling this balance effectively include:
Application monitoring software: balancing privacy, sampling, and troubleshooting context
The key is to choose an application performance monitoring (APM) or observability platform that removes sensitive data before storage, controls telemetry volume intelligently, and preserves enough trace context to diagnose real production issues.
These goals can conflict. Aggressive payload scrubbing can remove useful debugging clues, while aggressive sampling can discard the rare trace that explains a production incident. The strongest solutions let you control these trade-offs independently rather than forcing one global privacy or retention setting.
What I would evaluate
1. Payload scrubbing and privacy controls
Look for attribute-level redaction, masking of PII and secrets, URL/query-parameter scrubbing, and controls that run before data leaves your environment. Check whether scrubbing applies consistently to traces, logs, exceptions, and captured request/response bodies.
2. Intelligent sampling and retention
Prefer head and tail sampling, or equivalent controls, that retain error traces, slow requests, and unusual latency patterns while sampling routine successful traffic. Verify whether the vendor can make retention decisions after a trace has completed.
3. Enough context to reproduce and explain failures
Preserve distributed trace spans, service dependencies, exception stack traces, deployment versions, correlation IDs, and safe business-operation metadata. Confirm that sampling does not break trace continuity across services.
4. Tiered retention and cost control
Check whether you can retain high-value traces longer than routine telemetry, keep searchable logs for a different period, and adjust policies without losing the ability to investigate incidents.
Shortlist: strongest candidates
1. Grafana Cloud
(Best for configurable telemetry control)
Grafana's Adaptive Telemetry includes tail-based trace selection, allowing policies to retain errors and high-latency traces while dropping lower-value data. It also offers exemptions for signals you don't want optimized away.
Why it fits: Especially attractive if you want policy-driven sampling and an OpenTelemetry-oriented architecture.
Validate: Payload scrubbing requirements, collector configuration, and the actual retention tiers available to your plan.
Datadog combines configurable trace-retention filters with a Sensitive Data Scanner that can redact, partially redact, hash, or mask sensitive values in supported telemetry. Its retention filters can preserve error traces and important distributed-trace context.
Why it fits: A strong candidate when you want APM, logs, security-oriented data scrubbing, and retention policies in one platform.
Validate: The scanner's documented APM coverage is span attribute values, not arbitrary request and response bodies. Confirm coverage for every data source you intend to protect.
New Relic provides configurable retention across different telemetry namespaces and browser-data obfuscation rules. Its APM agents use adaptive sampling for distributed tracing.
Why it fits: Worth evaluating when retention requirements differ by data type or you need a mature full-stack monitoring platform.
Validate: Confirm whether the sampling behavior meets your error-retention needs and whether its obfuscation rules cover your sensitive server-side payloads.
Redaction before export or ingestion, including secrets in nested attributes and exception messages
Sampling
Retain 100% of selected errors and slow traces, subject to an explicit policy
Trace context
Preserve all spans belonging to a retained distributed trace
Retention
Separate retention controls for traces, logs, and other telemetry where supported
Cost control
Measure ingestion, indexing, scanning, and storage separately
Verification
One important architectural point: tail sampling is only as effective as the data it receives. If you discard too much telemetry at the application or collector before the tail sampler sees it, you can lose the very outlier that would have revealed the incident. Grafana's documentation explicitly describes this trade-off in its multi-tier sampling guidance.
Also consider: Honeycomb + Refinery
This is a particularly relevant alternative if trace-level sampling is your central concern. Refinery evaluates complete traces and supports rules-based sampling, including keeping all error traces while sampling routine successful requests. Honeycomb's managed Refinery offering also supports redaction before telemetry leaves your environment.
Start with Grafana Cloud, Datadog, and Honeycomb + Refinery. Compare New Relic as well if retention flexibility is a major requirement. If you want vendor independence, consider using the OpenTelemetry Collector to scrub sensitive attributes before export and perform tail sampling on complete traces. Its redaction and tail-sampling processors support these two functions, although you will need to validate processor maturity and operational complexity.
The right choice depends on one important distinction:
Where does the sensitive payload need to be scrubbed? Redacting span attributes is much simpler than inspecting and selectively redacting full HTTP request/response bodies, SQL parameters, and exception messages.
What kind of environment are you monitoring?
1. Deployment preference
SaaS monitoring platform
Self-hosted / private cloud
Either, if the controls are strong
2. What data needs scrubbing?
Span attributes, tags, and logs
PII and secrets across logs, traces, and exceptions
Full HTTP payloads, request/response bodies, or SQL parameters