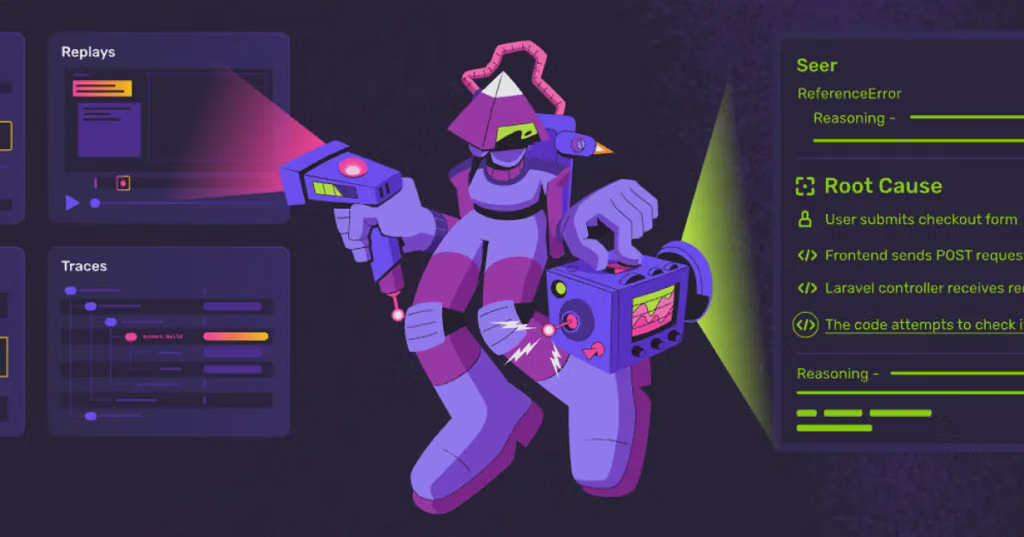
The strongest options are Sentry, Datadog, and New Relic. All three can connect frontend errors with backend tracing and release or deployment context, helping engineers investigate a problem without manually correlating several monitoring tools.
The key distinction is whether you want a developer-focused error issue, a unified observability platform, or a centralized error inbox across your stack.
Top platforms to consider
1. Sentry
(Best for developer issue workflows)
Connects frontend exceptions, backend errors, distributed traces, stack traces, and releases. Its frontend monitoring can show the API request and trace associated with an error, and release tracking helps identify which version introduced a regression.
Best for: Teams that want an issue-centric workflow for debugging application bugs.
Website:
2. Datadog
(Best for end-to-end observability)
Links Real User Monitoring (RUM) requests to corresponding backend distributed traces. This lets you move from a browser-side problem to the backend service and related telemetry. Deployment and version context can be added through application version tags and deployment tracking.
Best for: Teams monitoring frontend, backend, infrastructure, and logs in one platform.
Website:
3. New Relic
(Best for a unified error inbox)
Its Errors Inbox combines errors from browser monitoring, APM, mobile, and serverless applications. Error details can include stack traces, related distributed traces, logs, and occurrences by version, with deployment markers when change tracking is configured.
Best for: Teams that want to triage cross-stack errors and track whether a deployment fixed or reintroduced a bug.
Website:
Other viable alternatives
Platform
Why consider it
Elastic Observability
Connects browser requests to backend services in end-to-end distributed traces.
Honeycomb
Strong trace-centric debugging with frontend instrumentation and OpenTelemetry support; error details can be attached to trace spans.
How they compare against your exact requirement
Capability
Sentry
Datadog
New Relic
Frontend errors
Yes
Yes
Yes
Frontend-to-backend trace linking
Yes
Yes
Yes
Release/deployment context
Releases
Version tags and deployment tracking
Version tracking and deployment markers
Centralized error issue/inbox
Core strength
Error Tracking
Errors Inbox
Primary orientation
Debugging issues
Full-stack monitoring
Unified monitoring and error triage
The integrations need to be configured correctly; these relationships are not guaranteed merely by installing a single SDK. Distributed tracing propagation, source maps where relevant, version metadata, and deployment markers are important.
My recommendation: Start with Sentry if you want one developer-facing issue that brings together an error, its trace, and the release that introduced it. Choose Datadog if you also need broad infrastructure and service monitoring, or New Relic if a unified error inbox with version-based regression tracking is central to your workflow.
The deciding question is: do you want the issue itself to be the primary workflow, or do you want to navigate from a full-stack observability platform into the issue?
A modern full-stack observability and application monitoring (APM) platform unifies frontend errors, distributed backend traces, and release/deployment versions into a single consolidated issue or event view.
The primary platforms capable of connecting these telemetry types into one centralized issue include:
Sentry
How it works: Sentry groups identical or similar occurrences into a single Issue . By utilizing distributed tracing headers (sentry-trace and baggage ), it links browser/frontend JavaScript exceptions directly to backend API/service traces.
Releases & Deployment Version: Through Sentry Release Tracking , it explicitly tags the issue with the deployment version (release ), identifies "first seen" vs. "last seen" releases, surfaces suspect commits/pull requests, and maps minified frontend code via source maps to the exact deployment version.
Datadog (Error Tracking & APM)
How it works: Datadog Error Tracking groups frontend (Browser/Mobile) and backend (APM) errors into unified Issues based on stack traces, error types, and fingerprinting.
Releases & Deployment Version: By injecting version tags (version or env configuration tags) during CI/CD builds and RUM (Real User Monitoring) initialization, Datadog correlates the unified error issue with deployment versions, allowing you to see which deploy introduced or spiked a specific error alongside full distributed flame graphs of the backend trace.
New Relic (Errors Inbox & APM)
How it works: New Relic's Errors Inbox aggregates exception data across full-stack applications. It connects browser errors (via Browser Monitoring) down to underlying service calls and distributed traces.
Releases & Deployment Version: It associates errors with specific deployments/release markers sent via their CLI or CI/CD integrations, letting you filter or group issue occurrences by version.
Dynatrace (Davis AI & Problem/Error Analysis)
How it works: Dynatrace automatically maps end-to-end topology using OneAgent. Frontend user actions and JavaScript errors are tied directly to PurePath distributed traces on the backend.
Releases & Deployment Version: It tracks application versions and builds natively, rolling related infrastructure, code, and frontend problems into a unified Problem notification detailing the exact release timeframe.
If you are currently evaluating these for a specific stack (like React + Node.js , or Next.js ), let me know and I can share how setup and source map uploads differ between them.
You’re looking for full-stack observability with issue correlation: a tool that connects a frontend JavaScript error to the backend distributed trace behind it, then shows which deployment or release was active so you can investigate everything as one issue.
My first two candidates would be Sentry and Datadog. New Relic is also a strong fit, especially if deployment tracking and a centralized errors inbox are important.
Best tools for your use case
1. Sentry
(Best starting point)
Strong fit if you want developer-focused error tracking, issue grouping, release information, distributed traces, and session replay in one workflow. Sentry can connect frontend and backend errors through distributed tracing and associate issues with releases.
Best for: React, Next.js, Node.js, Python, and other application stacks.
Best if you need a broader observability platform across frontend monitoring (RUM), backend APM, infrastructure, logs, and distributed traces. Its RUM-to-trace correlation connects a user's browser activity to corresponding backend requests.
Best for: Microservices, cloud infrastructure, and larger production environments.
Particularly relevant if you want a centralized Errors Inbox with release-aware error groups, browser-to-backend tracing, and deployment change tracking. Its version tracking can show which releases coincide with an error group's activity.
Best for: Teams that want application monitoring and deployment analysis in one platform.
One important distinction: connecting frontend errors, backend traces, and deployment versions isn't always automatic. You typically need tracing propagation configured across frontend API requests and backend services, plus release or deployment metadata attached to telemetry. Sentry documents both backend error linking and release creation; Datadog and New Relic document their own correlation setup.
Let me narrow it down
What is your application's tech stack? That will help me recommend the tool most likely to deliver the unified issue view you're after.
1. Frontend and backend
React / Next.js + Node.js
React / Next.js + Python
Vue / Angular + Java or .NET
Mobile app + API backend
Mixed stack / other
2. Most important capability
One issue linking errors, traces, and releases
Reproduce the user's experience with session replay