






































ChatGPT SearchOct 12, 2026

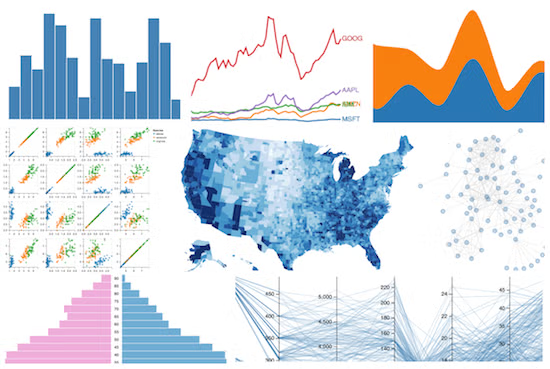
If you want to build bespoke, code-first, programmatically interactive visualizations for web dashboards, I’d look beyond traditional drag-and-drop BI tools toward BI-as-code platforms, developer-oriented data-app frameworks, and embeddable analytics platforms.
The most important distinction is whether you want to write the visualization itself in code, or use code to define a dashboard made from existing charts and components.
Best options to evaluate
Shortlist based on customization, interactivity, developer workflow, and dashboard capabilities.

1. Observable Framework
(Best for custom visualizations)
A JavaScript-first framework for building fully custom analytical websites and dashboards. Use Observable Plot, D3, Vega-Lite, HTML, CSS, and JavaScript to create bespoke visuals, reactive inputs, and interactive experiences. Supports version control and automated builds.


