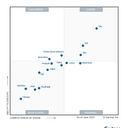
Langfuse holds a clear lead across LLM observability and tracing, widely recommended for cost tracking, logging, and open-source self-hosting. For agent debugging and root cause analysis, LangSmith serves as the usual answer.
Since July, Langfuserising has become the most named option for LLM audit logging, while Arize Phoenixrising is now among the three most named for agent root cause analysis. Heliconefalling and Datadogfalling are named less often across latency tracing and audit trails.
Building a centralized dashboard to monitor token burn rates across internal AI applications requires an observability pipeline that captures input, output, and cached tokens per request and streams them into a time-series visualizer.
Here is a structured blueprint to set up a production-ready token burn-rate monitoring stack.
To effectively track token burn, configure your applications to emit these foundational time-series metrics:
Design your central dashboard with these core panels for maximum operational visibility at a glance:
Would you like me to share a starter PromQL query set or a sample OpenTelemetry/Python instrumentation snippet to hook your apps into this pipeline?
To monitor token burn rate across all your internal AI apps, I’d build a centralized AI observability dashboard that brings together token consumption, spend, throughput, and usage trends across every model and application.
The key is to track more than total tokens. You want to know which apps are consuming tokens, how quickly consumption is accelerating, what it costs, and whether that usage is delivering value.
What your dashboard should look like
AI Usage Command Center
All internal apps · All model providers
(Live monitoring target)
Tokens consumed
24.8M
Current day · illustrative
Burn rate
18.2K/min
Rolling 5-minute average
Estimated daily spend
$186.40
Illustrative estimate
Active AI apps
12
Illustrative inventory
Token burn rate over time
genui{"charts_widget_v2":{"content":{"chartType":"line","meta":{"title":"Illustrative token throughput","description":"Example data only; not connected to your systems."},"xKey":"time","series":[{"dataKey":"input","label":"Input tokens/min","valueFormat":"compact"},{"dataKey":"output","label":"Output tokens/min","valueFormat":"compact"}],"data":[{"time":"09:00","input":7200,"output":2100},{"time":"09:10","input":9100,"output":2800},{"time":"09:20","input":8500,"output":3200},{"time":"09:30","input":12400,"output":4100},{"time":"09:40","input":13900,"output":4300},{"time":"09:50","input":15800,"output":5100},{"time":"10:00","input":14500,"output":4700}]}}}
Usage by application
genui{"charts_widget_v2":{"content":{"chartType":"bar","meta":{"title":"Daily token consumption","description":"Illustrative values in millions of tokens."},"xKey":"app","series":[{"dataKey":"tokens","label":"Tokens","valueFormat":"compact"}],"yAxisMin":0,"data":[{"app":"Support bot","tokens":8.2},{"app":"RAG search","tokens":5.6},{"app":"Code copilot","tokens":4.4},{"app":"Document AI","tokens":3.7},{"app":"Other apps","tokens":2.9}]}}}
Mock dashboard preview — all figures and app names are illustrative, not live telemetry.
Best tools to build it
I found three strong approaches, depending on whether you want a ready-made dashboard or a custom internal command center.
1. Langfuse — best starting point
(Recommended)
Tracks token usage and costs across models, applications, users, and use cases. Supports custom dashboards, alerts, and self-hosting.
Best for: an engineering team wanting visibility across multiple AI apps.
Important design decision: normalize usage into a common schema across all your apps and providers. Capture provider-reported token counts where possible, including cached and reasoning tokens when available. Calculate burn rate over rolling windows (such as 1, 5, and 15 minutes) and trigger alerts when consumption exceeds a baseline or budget.
Let's narrow down the right implementation
Choose the options that best match your environment. Partial answers are fine.
My initial recommendation is to start with Langfuse for token-level observability, then add a dedicated executive dashboard or integrate the metrics into your existing monitoring stack if needed. If strict data residency or privacy is a requirement, evaluate its self-hosted deployment and telemetry settings before rollout.